
How to understand your Floorplan Analytics
- Login to the Dashboard of your property website at manage.beswifty.com.
- In the left sidebar, navigate to Analytics > Floorplan Analytics.
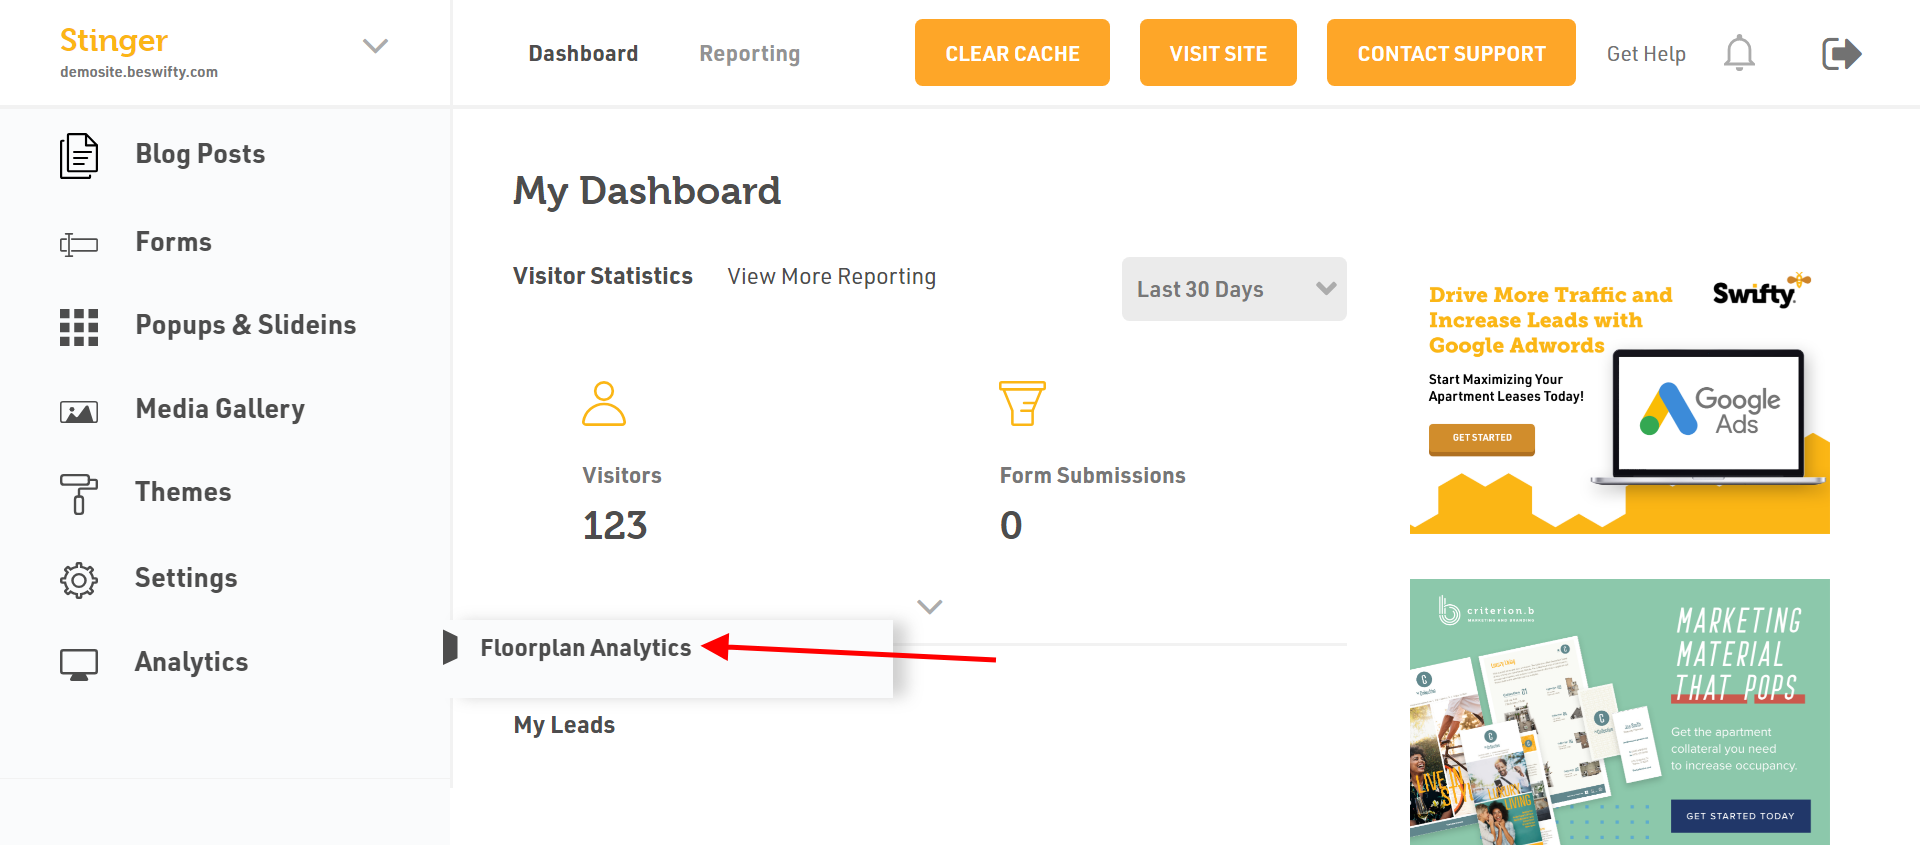
- Here, you can view metrics on all your propertys floorplans. Youll see data such as daily floor plan clicks, total views, average time spent on each floorplan, conversion rate, and more.
- After scrolling down a little, you will see title Clicks per Floorplan. It shows the total number of times a specific floorplan has been clicked by visitors. This helps you understand which floorplans are attracting the most attention.
- After clicking on the small arrow which faces downward, you can see detailed reports of visitors including returning visitors, new visitors, which page customers are visiting more, etc.
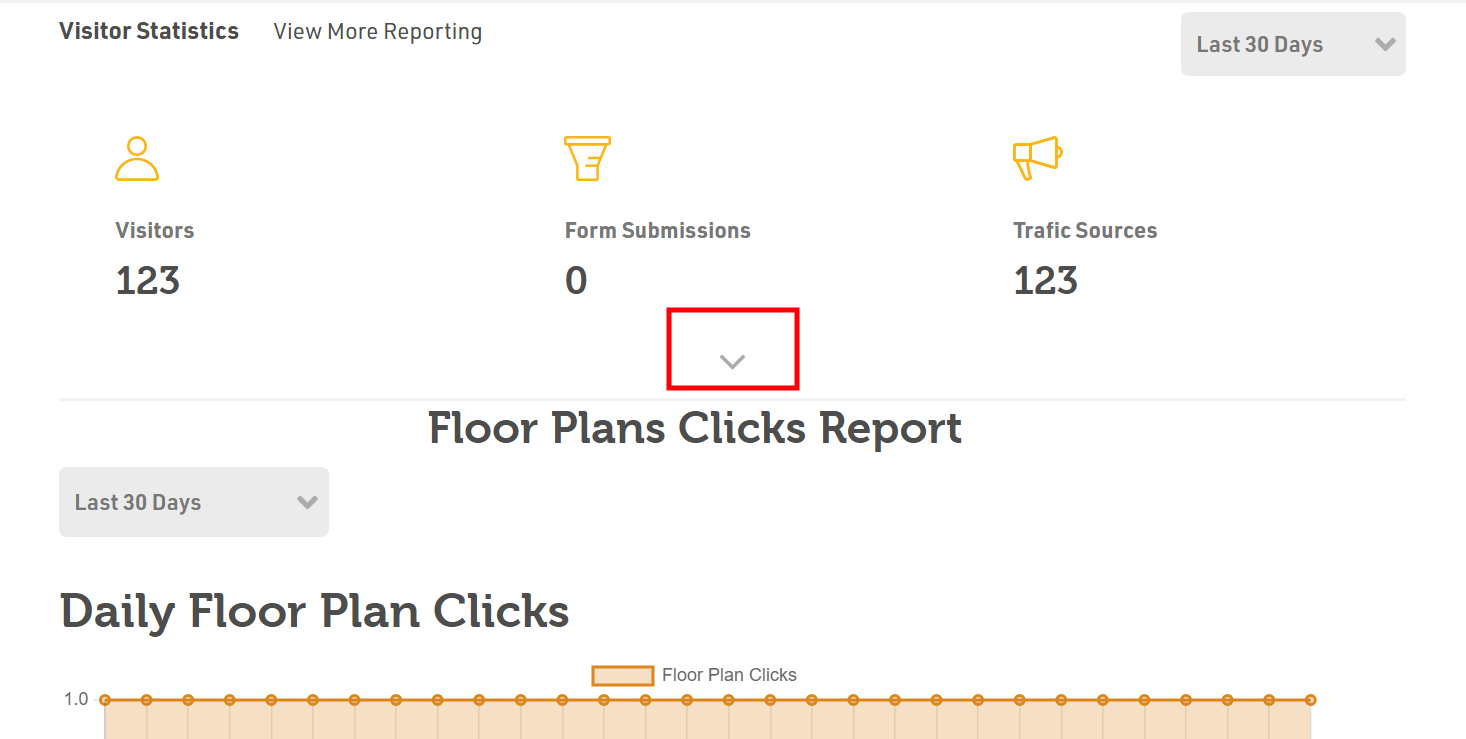
- Use the data from Floorplan Analytics to understand how your floorplans are performing. For example, if a floorplan has many views but few conversions, you might need to improve the call to action or images for that floorplan.
- Based on your insights from the analytics, make necessary adjustments to your floorplans.
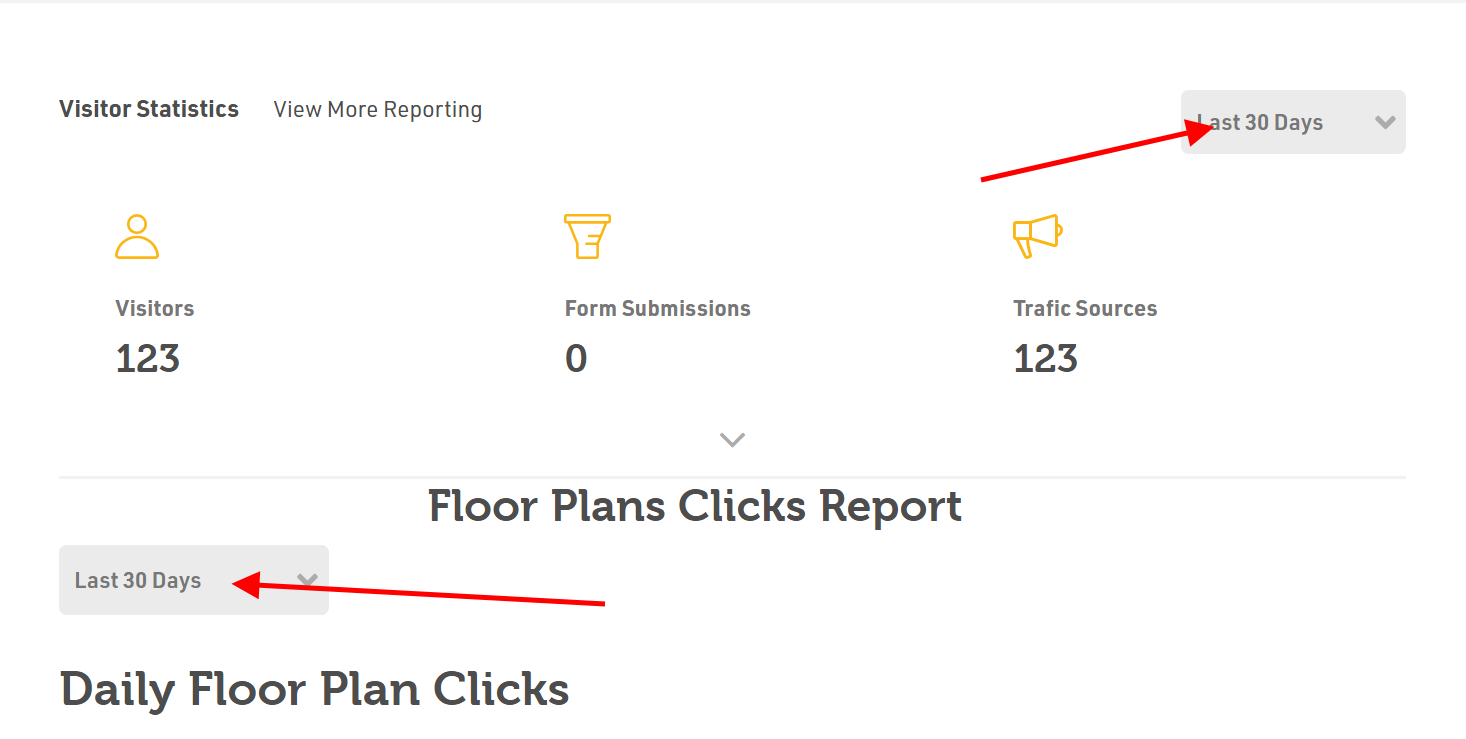
- You can even look analytics for last 180 days, 90 days and 30 days. Click on the drop-down arrow and you can change the days according to your requirements.
Was this article helpful?
Thanks for the feedback.